When analyzing national breeding indexes, we’ve learned one size does not fit all. In fact, indexes differ quite drastically to accommodate varying breeding philosophies. While these indexes all aim to create a unified ranking for selecting genetics, the development of any index is challenging.


The LPI formula was created by the Genetic Evaluation Board of the Canadian Dairy Network. It is intended to be used to rank Holstein cattle and assist dairy producers in identifying superior Holstein cattle that combine high production, sound conformation and desirable health and fertility.
LPI is considered the industry standard in Canada and its application has crossed seas to reach a myriad of dairy producers. But have you ever sat down and considered how the index actually works or what impact certain traits have within the index?
We must realize any index is subject to change over time – and rightfully so, as production conditions and prices change for the average farm within a country.
For LPI, weightings change when the board determines they more accurately reflect what breeders desire in terms of a balance between traits. These small changes can have huge impacts on industry ranks – and therefore perceived value.
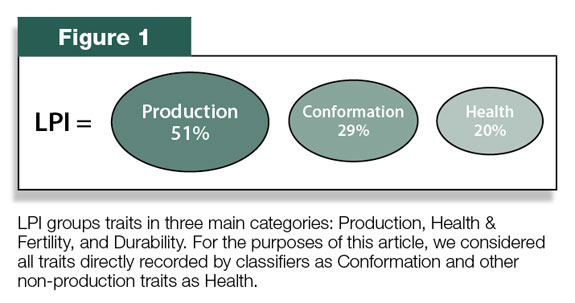
An easy way to think of LPI is to group the formula’s traits into three main categories with their relative weighting, as in Figure 1.
When expressed in the same trait categories as TPI (production, conformation, health and fertility), the weightings are 51, 29 and 20, respectively.
Production traits, for example, receive the most overall emphasis (51 percent) in the LPI formula.
When considering the LPI index, we can say that while these weights might be the right weights for the “average Canadian dairy,” the real question needs to be: “Are these the right weights for my dairy?”
The top LPI lists and rank
Indexes are a very important selection tool because they combine all the important traits into one value. They get us away from setting minimum criteria for particular traits, which limits genetic progress.
However, the weights in the three contributing index categories (production, health, conformation) are extremely influential in ranking the sires, making certain traits more or less important than you might perceive or value for your operation.
These category weights differ from index to index and are one of the reasons why bulls can rank very differently on one list versus another (i.e. LPI list vs. TPI list).
So what does the rank on the LPI list really mean? We know the perception is higher ranking equals “better,” but “better” is a very subjective term. Is the 100th bull really that much better than the 200th bull, for instance? Let’s look at an example.
Impact of certain traits on LPI
Assume we have three bulls, AltaVITTEK, Bull A and Bull B. AltaVITTEK has a sporty LPI value of 3021, ranking him in the upper echelon of bulls with semen available.
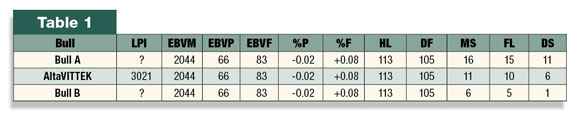
Bull A, Bull B and AltaVITTEK have identical breeding values except Bull A is exactly five points higher for each mammary system, feet and legs and dairy strength and Bull B is exactly five points lower for the same traits (Table 1).
What would you guess the LPI of Bull A and Bull B to be, based on these conformation trait differences?
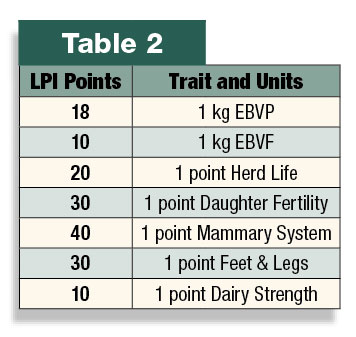
Of course to answer this question, you need to know the impact of each trait in the LPI formula. See Table 2 for the points assigned to each trait.
Note that Herd Life (HL) and Daughter Fertility (DF) are standardized to an average of 100. Therefore, bulls gain or lose LPI points based on their prediction for these traits relative to 100.
For example, a bull with a HL prediction of 101 would gain 20 LPI points, while a bull with a prediction of 99 for HL would lose 20 LPI points.
Based on these differences and the information listed above, what would the GLPI be for Bulls A and B? Where would these bulls rank on the industry-wide GLPI list?
The Top 100 vs. Top 200 LPI
The difference in GLPI between the top 100 and top 200 GLPI-ranked bulls has become very small. In fact, when considering the industry-wide top GLPI list of bulls greater than 14 months old, only 117 points separate the 100th bull ranked for GLPI from the 200th bull.
Additionally, only 317 points separate the 100th from the 500th-ranked bull for GLPI. That means 400 bulls are within 318 LPI points of each other.
This is certainly not something we were used to prior to genomics but, because so many more bulls are being tested now, it is a new reality in the industry. The conclusion is obvious: The importance of “rank” on these lists has little significance, as the difference between bulls is very small.
Impact example continued
If you did the calculations, you should have discovered that Bull A would have a GLPI of 3421 and Bull B would have a GLPI of 2621.
Bull A would rank #3 in the industry for GLPI, and Bull B would rank #559; however, it could easily be argued that the traits that have real quantifiable value (production and health) are identical across all three bulls.
Even a two-point increase or decrease for MS, FL and DS results in large changes in rank. Using the example above, a two-point increase for MS, FL and DS for AltaVITTEK would result in a rank of #25 on the industry GLPI list, while a decrease of the same amount for the same traits would result in a rank of #195.
Based on what you’ve learned by reading about LPI, rank and by going through the provided example, the conclusions should be clear: Conformation traits have a very large impact on the LPI formula as it is currently weighted; a bull’s LPI rank will change disproportionately with small increases or decreases in individual traits because of the number of bulls now being genomic tested; and the best “LPI formula” is the genetic plan you develop with your genetic consultant.
It’s easy – just put your weights in the circles for production, health and conformation.