A sudden and unexpected drop in milk price has put pressure on the balance sheet, while input costs have remained relatively stable. What is the best strategy when money is tight?

Margin over feed cost
We often hear the comment, “My feed bill is too high.” There is an easy fix to this: stop buying. For the keen managers you are, you know this is too simplistic. If you cut something, will there be an impact on production, components, body condition, conception rate, etc.?
It doesn’t mean that you should never make any changes, but consider them carefully. You make a living out of the money that is left: money in minus money out. This is what we call margin over feed cost.
Money in
Milk price varies a lot from farm to farm depending on milk components. Based on the March component values, 5.5 kilograms (kg) per hectolitre (hl) butterfat and 4.3 kg per hl protein milk was worth close to $100 per hl, while 4.2 kg per hl butterfat and 3.6 kg per hl protein milk brought in a little more than $80 per hl. However, a higher price per hectolitre doesn’t necessarily mean a bigger cheque.
The amount of your cheque is price per unit multiplied by number of units. Those farms with a higher milk price won’t be so happy if they are not making the quota or the incentive days. A higher demand for butterfat is certainly a positive trend for the whole industry, and many farms have taken advantage of the opportunity to increase milk sales income.
The current context favours high-component milk. To fill the quota, 4.2 kg per hl milk requires 10 percent fewer cows than 3.8 kg per hl milk. It follows that, 10 percent fewer cows means less forage, fewer replacements, etc. Herd genetics are rarely a limiting factor to high butterfat and protein milk.
The majority of Canadian dairy farms can easily understand their herd genetic potential (Figure 1) by referring to the Herd Genetic Inventory report (produced by CDN via Valacta or CanWest DHI). With an index of +0.09 percent for fat and +0.03 percent for protein, the genetic base for the depicted herd is strong.
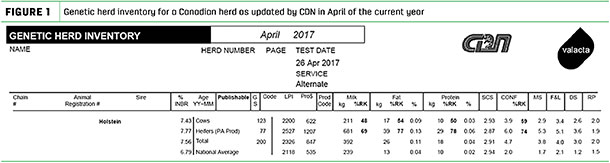
Click here or on the image above to view it at full size in a new window.
Money out
Could the feed bill be too high? Certainly. Could it be too low? Both are possible. A very low milk price with low feed costs may well result in a disappointing margin.
How do you know if your feed cost is too high? It’s pretty simple: know what your cost is and compare it. Valacta monitors milk values, shown in Table 1, and feed cost thus giving dairy farmers a chance to compare themselves to others. Forages are figured at a standard price: hay and haylage at $215 per ton of dry matter and corn silage at $170 per ton of dry matter.
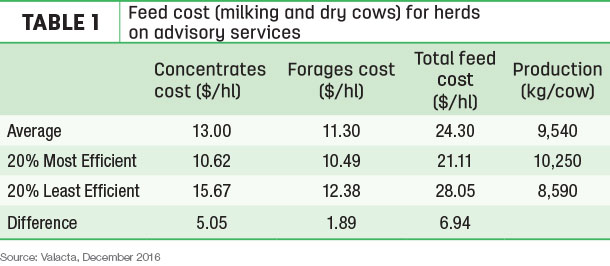
These values are updated every year with Agritel database (management clubs operating in Quebec and eastern Ontario). Homegrown grain and cereals are figured at market value, including storage and processing cost.
What about my farm?
Key words are “know” and “compare.” Concentrates costs vary a lot from one farm to another for the same time period. Figure 2 presents the results for a farm unhappy with feed costs at the end of the 2015 fiscal year. They shipped 14,300 hl over a 12-month period.
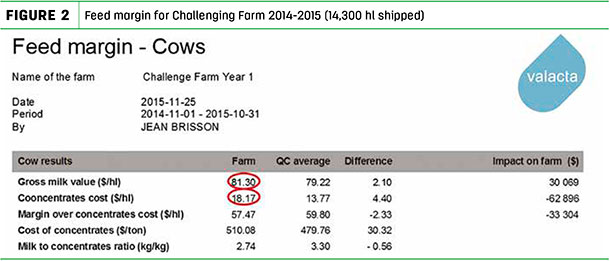
*Margin over concentrates cost ($/hl) was calculated after deductions (transportation, marketing, etc.).
Click here or on the image above to view it at full size in a new window.
Milk value was above average by $2.10 per hl due to high component production (4.31 kg per hl fat and 3.42 kg per hl protein), leaving them with an advantage of $30,000. Concentrates costs were above average by $4.40 per hl, leaving them with a disadvantage of $63,000 as compared to other herds.
This comparison clearly demonstrated that action was required – an action plan with follow-up was next on the agenda. This plan included a revision of grouping strategy, feeding strategy, etc.
Twelve months later the picture had changed. Figure 3 presents the results for the same farm at the end of its next fiscal year in October 2016. They shipped 16,730 hl over a 12-month period, thus taking full advantage of available incentives.
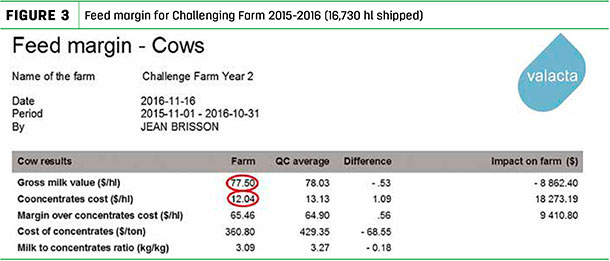
*Margin over concentrates cost ($/hl) was calculated before deductions.
Click here or on the image above to view it at full size in a new window.
Milk value had dropped below average for a difference of $0.53 per hl because of a lower butterfat (4.02 kg per hl fat and 3.48 kg per hl protein), leaving them with a disadvantage of $9,000. Concentrates costs were down, below average by $1.09 per hl, leaving them with an advantage of $18,000. They saw a difference in their bank account because of a better margin and also because they took full advantage of incentives.
Concentrates costs went from -$63,000 to +$18,000, which definitely qualifies as a significant change. The net gain was not $81,000 but $42,000 because of the loss on one side of the equation, but it was still significant.
Conclusion
Dairy farming is certainly a challenging business. Farming is not only milking, feeding, cleaning, planting, seeding, harvesting, but also managing. To manage well and be happy with the year-end result, you need accurate information on a continuous basis. You need to know, compare and implement an action plan when needed. ![]()
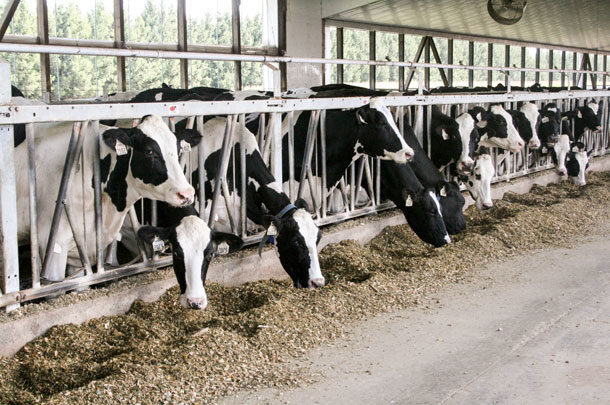
PHOTO: Photo by Karen Lee
René Roy is an agro-economist with Valacta.
Jean Brisson is a dairy specialist with Valacta. Email Jean Brisson.