As today’s dairy producers look to the future, becoming an expert manager of the financial side of dairy farming is just as critical to future business viability as animal husbandry, agronomy, nutrition and every other hat dairy producers wear. Having a short list of critical key performance indicators (KPIs) is very important to ensure that any on-farm changes can be tracked and producers can respond quickly to maintain animal health, production and, ultimately, ensure financial success.


Many producers have their favourite KPIs that they keep an eye on such as kilograms of butterfat per cow, kilograms of milk per cow, pregnancy rate, days in milk (DIM), etc. The following is a list of 10 less common, but no less important KPIs broken up into four key areas today’s dairy producer should consider monitoring to help drive profitability.
Production KPIs
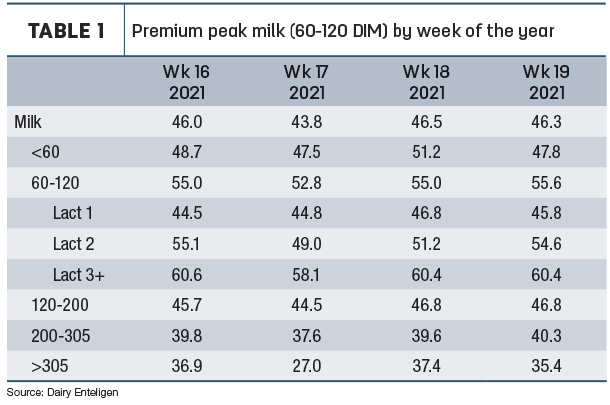
1. Peak milk (60 to 120 DIM) by parity: First-lactation animals have the potential to peak at 80% to 87% of the milk volume of mature cows within a herd. Second-lactation peak should peak at 88% to 94% of mature cows. Tracking this KPI allows the dairy producer to identify which lactation group to focus on to improve and can also be used to track any changes in management over time. Is the issue on-farm that mature cows are peaking too low, or should the target be in improving first-lactation performance? Compared to other peak milk KPIs, looking at a period of time out to 120 DIM captures whether or not peaks are quickly dropping off or are more persistent (see Table 1).
2. Mature equivalent milk 305 by parity: What’s the potential production of the herd? This KPI extrapolates the 305-milk by parity as if they were a mature cow. This allows the dairy producer to determine the potential of their actual first-lactation animals two years down the line when they are in their third lactation. Younger animals should have a higher genetic potential and subsequently a higher 305ME. Does the 305ME improve from first to second lactation? If so, investigating heifer rearing would be a logical conclusion. Keeping track of this KPI on a regular basis can also aid in troubleshooting transition if decreases are noticed during certain periods of time.
3. Component efficiency: How efficiently does a herd produce butterfat and protein? This KPI is a measure of feed efficiency that focuses on the total amount of fat and protein produced and how much feed was required to do so. High levels of fat and protein production are important but, with today’s feed prices, maximizing the efficiency of converting dry matter to milk solids drives feed costs down and improves profitability.
The average Canadian herd has a component efficiency of just under 10%, while top herds producing over 3 kilograms of fat and protein combined have a component efficiency over 11.6%. Tracking this KPI allows for proper evaluation of changes in rations or herd dynamics. Focusing on producing highly digestible forages to fuel the rumen is one way to improve this KPI.
Herd dynamics KPIs
4. Percentage heifers versus total mature cows (lactating + dry): Depending on a herd’s objectives and culling rate, percentage of heifers versus mature cows should be monitored. The top producers in Canada have an efficiency of 72% of replacement heifers versus mature cows. If the objective is to grow the herd or if a farm has a profitable market for fresh animals, producers should calculate a buffer and raise a few more replacements than needed.
However, typically the number of heifers should be just enough to maintain the mature herd based on a farm’s culling rate, heifer non-completion rate and age at first calving. On many operations, the number one area to focus on to reduce feed costs is reducing the excess heifer population. Not only are too many heifers expensive, but also overcrowding a heifer barn increases pathogen load in the barn, reduces average daily gain (ADG) and has a direct negative impact on first-lactation performance.
5. Days dry: Is the average days dry close to the planned objective for the herd? More importantly, what is the distribution of animals around the average? Are there significant amounts of animals dry for too short or too long? Studies show that cows dry less than 35 days or longer than 80 days will have negatively impacted milk production, higher transition disease incidences and increased SCC. Has the average days dry in a herd changed over time? In many herds with a breeding focus on calving ease, gestation length has decreased by a number of days. If so, investigating days carried calf and making an adjustment to dry-off timing may be warranted.
6. Average parity: While many KPIs measure longevity in the herd, focusing on the average parity captures the balance between having a sufficient number of first-lactation animals to maintain the herd and maximizing the amount of healthy, productive mature cows. On many farms, cows do not become profitable until their second lactation, so increasing the population of older, healthy cows in the herd drives profitability.
A healthy cow’s fifth lactation has the highest production potential, and their sixth lactation is when they reach peak feed efficiency. Many cows exit the herd before they are able to express their full genetic potential. Focusing on cow comfort, transition, reproduction and lameness are important to improve this KPI.
7. Percent culled by 60 DIM: This KPI is a great way to measure the success of the transition program on a dairy farm, as it captures the number of cows that left the herd due to transition failure, as other culling reasons such as reproduction are typically further on in lactation. When considering this number, it is important to separate out voluntary versus involuntary culls, as an operation selling fresh animals for dairy sales may have a higher number. A goal of under 5% is attainable for herds that have excellent transition success. Monitoring this number over time can be used as a benchmark to determine if the transition program is improving or needs attention.
Reproduction KPIs
8. Days from first insemination to pregnancy: This KPI tracks how many days it takes on average for a cow to get pregnant after her first breeding. When conception rates are not sufficient, this number can increase. As a result, DIM and calving interval can become extended. Monitoring this KPI by lactation group and over time can point to issues in certain lactation groups or periods of time.
9. Percent pregnant by 150 DIM: This KPI is one of the best numbers to look at as a measure of reproductive success. Even though across farms voluntary wait periods, heat detection systems and synch programs all differ, the end goal of having the majority of cows pregnant by mid-lactation is the same. A goal of 80% is attainable for many herds, with top herds approaching and exceeding 90% in Canada.
Profitability KPI
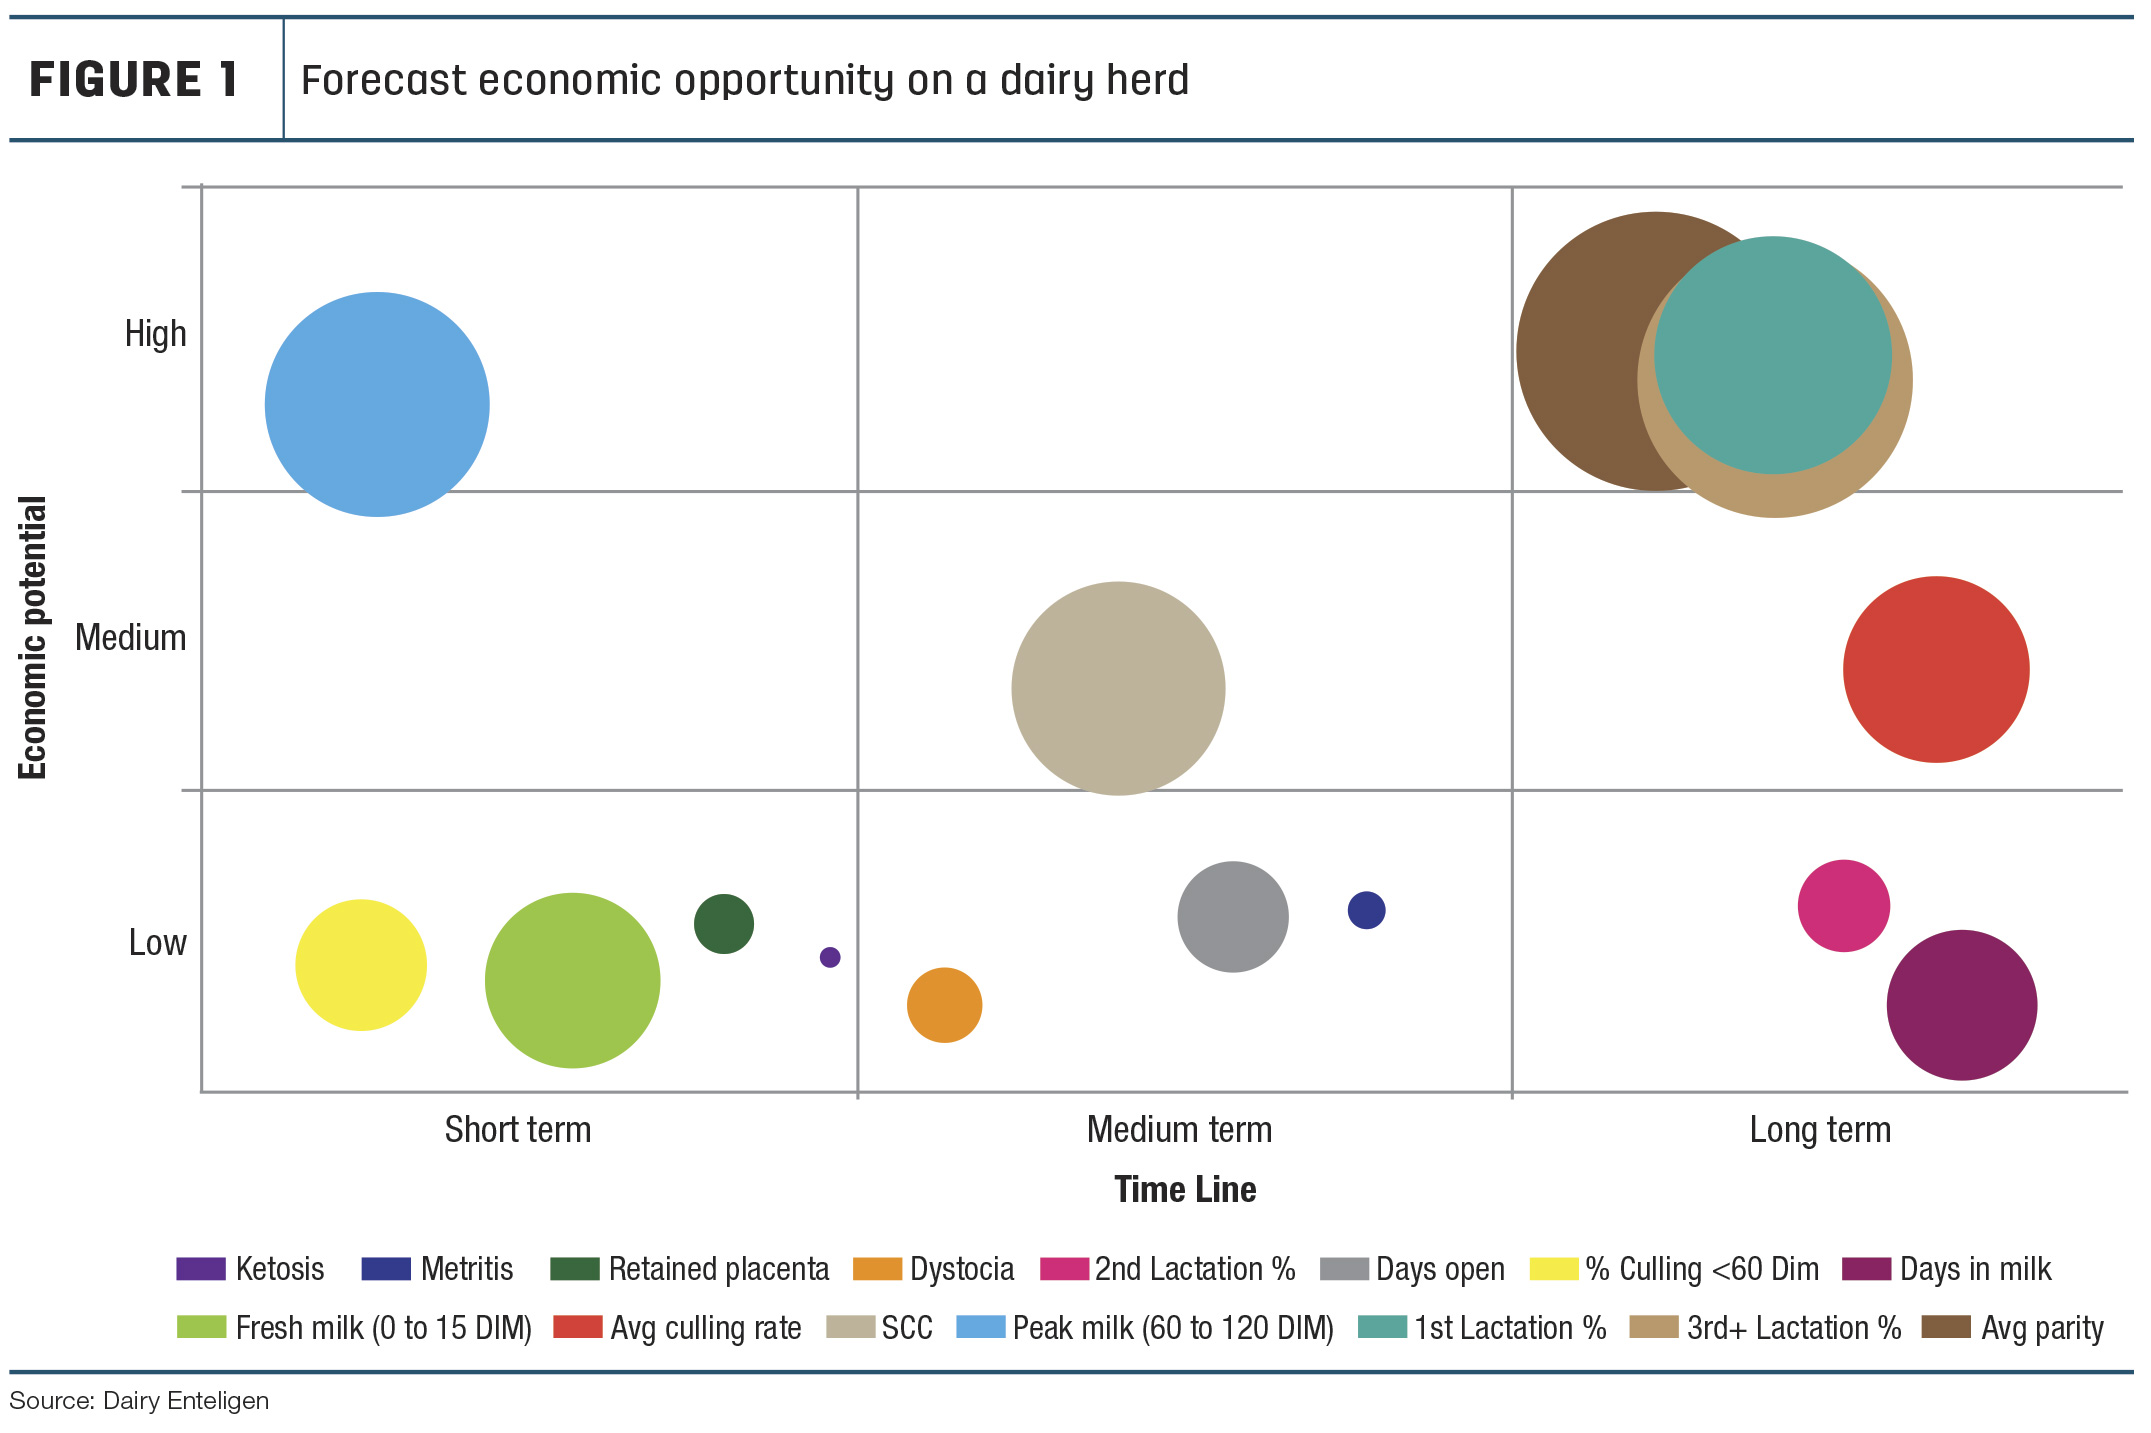
10. Return over feed: Monitoring income over feed costs is an excellent KPI that can be used to evaluate the impact of management or ration changes on profitability. This KPI can be used to benchmark a farm against themselves over time (monthly or quarterly) or against other operations locally or provincially. Even in a quota system, there is a strong correlation with ROF to other common benchmarks, such as feed cost per litre or return per kilogram of butterfat. As milk production and ROF increases, feed cost per litre decreases and return per kilogram of butterfat increases as well (see Figure 1).
To ensure future business viability and profitability, producers should consider monitoring a specific list of important KPIs. Tracking these KPIs on a regular basis and reviewing the current numbers versus historical data allows dairy producers to identify areas that need attention in short-, medium- and long-term timeframes and allows them to focus on the areas that will have the largest economic impact.