One advantage in the dairy industry is access to financial and production information to benchmark against. The Canadian Dairy Commission (CDC) reports the cost of production results from the national cost of production (COP) data project.

The individual provinces or regions that supply the data for the national COP also produce summary reports for a regional view.
CDC results for 2020 indicate a 2.8% increase in COP per hectolitre (hl) from 2019 nationally. Most of the increase was due to cash costs, a smaller increase in capital costs with labour remaining stable.
Identifying trends year-over-year from the CDC summary reports is useful to provide the broad industry perspective on performance. Individual producers can also benchmark themselves by looking at the regional data separated into low- and high-cost producers.
The 2020 Ontario Dairy Farm Accounting Project coordinated by Dairy Farmers of Ontario reports the results in bottom, middle and high groups based on their COP per hl. This allows you to compare your results across these three groups (the bottom farms being the highest-cost producers and the top, the lowest).
Production drives cost of production, so having a good handle on your farm’s productivity is important.
Table 1 highlights the results for the bottom, average and top farms. The top farms had almost twice as many cows as the bottom group, produced 1,696 more litres per cow, and their labour productivity in litres sold per person was 2.5 times higher.
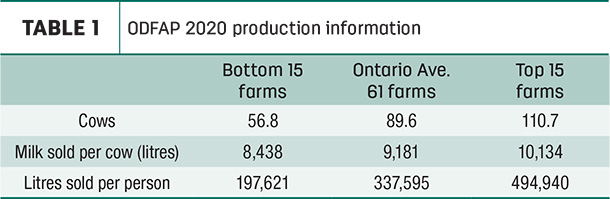
Table 2, presents the revenue and expenses per hl for these three groups to show how farm size and production differences translated into financial results.
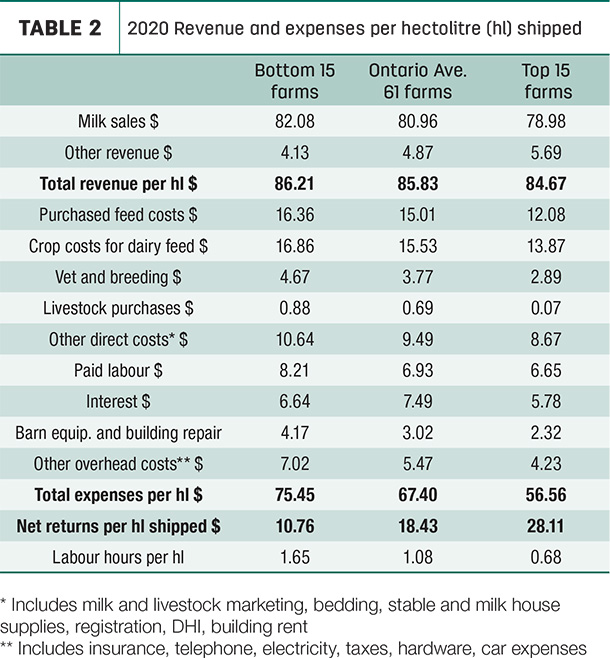
It is interesting to note the top group had lower milk sales and total revenue per hl than the bottom group, but were significantly more profitable. Their ability to control and manage costs was key to their success. The net returns per hl would be a return to unpaid labour, management and capital.
This reinforces that, with input costs continuing to rise, it is important to know and control your COP. This is not new or revealing, but from the results, you can see the top group is doing things differently to manage their costs to be more profitable.
Overall, the top group’s COP is 25% lower. Looking through the costs, the top group is incrementally better in most costs. Improvements across all the costs pays dividends rather than trying to hit the home run in one or two areas. With the costs broken down, you can identify those areas that impact your COP the most and warrant greater attention.
Feed costs, purchased and homegrown, represent 45% of the total costs, so it makes sense to concentrate planning time on knowing your feed costs. Total feed costs did contribute 38% of the cost difference between the top and bottom. Purchased feeds are straightforward, but how do you account for homegrown feed? Their costs will be spread across all the crop-related costs like seed, fertilizer and fuel. If the farm also sells cash crops, this further complicates the homegrown feed cost picture.
There are one of two ways to handle homegrown feed costs; they can be valued at cost, as it is reported in the ODFAP summary, or at market value. Market value involves removing all the homegrown crop expenses out of the dairy enterprise and “selling” the crops to the dairy enterprise at market value. Market value represents the opportunity cost of feeding the crops to livestock rather than what you would have received selling them. Regardless of the approach you use, having a good handle on feed costs is a good starting point in controlling your COP.
Dairy ration was the most significant cost difference for purchased feeds, and the top farms actually spent a little more on supplements. Machinery costs of fuel and repairs were the main drivers in the homegrown feed costs. The top farms did rely more on custom work in cropping expenses, which may suggest they are using custom operators to their advantage, allowing them to focus their labour and capital on more dairy-related tasks.
When unpaid labour and management are included with paid labour in the CDC report, labour costs accounted for 24% of total costs. Labour efficiency is a key area to focus on as well. The bottom group took 1.65 hours of labour to produce 1 hl of milk, where the top group only needed 0.68 hour. It starts with knowing where you are now. A labour time sheet is included in the ODFAP summary that can help to track and record labour requirements by task.
The question not answered in the COP data is: What were the management and production practices that made the difference for the top farms? But it does give you insights into areas of productivity or costs where you may differ from the top farms to provide a starting point into drilling down deeper into those areas for opportunities to improve.
Other provinces and regions that contribute to the national COP have similar reports to ODFAP. Wherever your farm is in Canada, seek out the summaries for your region and see how you compare.
References omitted but are available upon request by sending an email to the editor.


